Introduction
The RapidViews solutions aim to offer a real deployment accelerator for your SAP HANA BI projects but will also allow you to manage and maintain your BI. RapidViews are composed of virtual datamarts or data counters, predefined reports and fact/dimension views (HANA Views), which are the foundation of the solution. They are available on the SAP FI-CO, SD, MM and PP ERP modules.
We estimate that the RapidViews Standard solution covers on average 70% of the customer’s BI needs once installed. To cover the remaining 30% of the needs and thus satisfy all the additional requests of the customers, we propose to accompany them in the realization of the developments.
To do this, we use a method that is broken down into several stages :
- In the first instance we work directly with the client to understand their needs. This step results in the generation of technical specifications using a tool included in the RapidViews, the SmartRepository.
- At the same time, using the same tool, we determine which requests are already covered by RapidViews and which ones will need to be added to the model.
- Finally, once the developments in HANA Studio and the reporting are completed, we proceed with the acceptance of the data.
Use Case - Creation of the STOCK_VALUE view.
The factual view STOCK_VALUE was a real technical challenge for the RapidViews team: Since the main table MSEG (stock movements) does not always take into account price updates, the stock value at a moment T in the past is not always correct.
Calculating the stock value without taking into account the other tables (MBEW, OBEW, QBEW etc.) will give erroneous results depending on the case.
In order to solve this problem and to calculate the correct stock value or quantity at an instant T, we had to set up a complex calculation algorithm via a function table in HANA.
Summary of HANA developments
Several HANA objects have been created to meet this need:
–Table Type TT_STOCK_2: Created directly in the database. It is used as a type table by the internal tables used in the function tables.
–HDB procedure GetMandt : allows to retrieve the client.
–Function tables :
- STK_GET_MVTS: used to calculate the movement of stocks. It mainly consumes the MSEG table;
- STK_GET_SITINIT: provides the valuation of the stock. It mainly consumes the tables MARD (for the quantity), MBEW, EBEW, QBEW, OBEW and MARA;
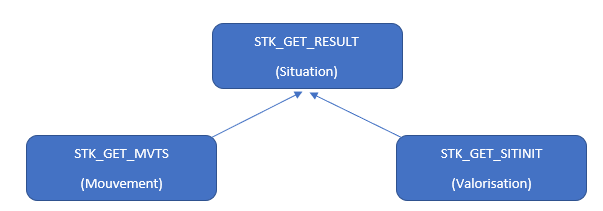
- STK_GET_RESULT: Mainly used to combine the two function tables to obtain the precise stock situation at a given time.
– HANA Calculation Views :
- F_STOCK_VALUE: Factual view that consumes the table function STK_GET_RESULT ;
- DTM_STOCK_VALUE: Datamart consisting of the factual view F_STOCK_VALUE and the necessary dimensions.
Subscribe to the Rapid Views Newsletter !
Stay up to date with our latest blog posts, upcoming webinars and news!
Details of the HANA developments carried out :
The HANA developments started with the creation of a table type TT_STOCKS to categorise the internal tables declared and fed into the function tables.
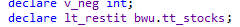
Next comes the creation of the STK_GET_MVTS table which retrieves the stock movements.
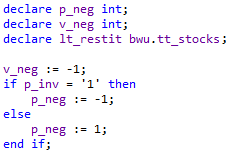
In this table (STK_GET_RESULT), we have therefore used the parameter p_inv: the movement values, according to certain types, are forced to be negative when joined to the stock valuation to enable the exact stock situation to be calculated.
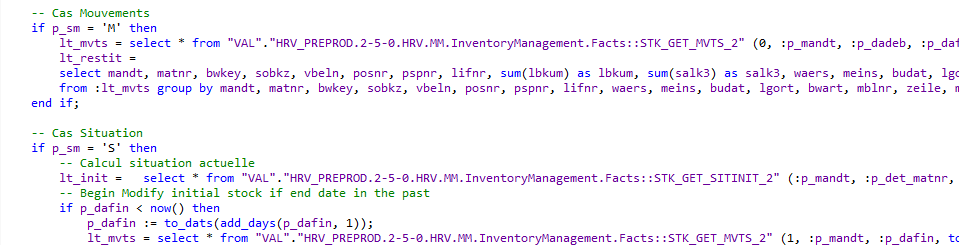
The STK_GET_SITINIT table retrieves the stock valuation from the MBEW, EBEW, QBEW, OBEW tables when it is a value, from the MARD table when it is a quantity or from the MSKA, MSPR, MSKU, MSLB tables when it is a special stock.
The development of the function tables ends with the creation of the STK_GET_RESULT table, which allows the recovery of data from the two previous tables.
It allows the visualisation of stock movements or the visualisation of the stock situation (calculated by taking into account the valuation and the stock movements as well as the price variation).
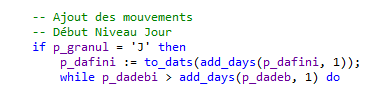
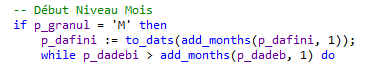
The calculation of the situation is done according to several temporal granularity (Day, Month or Year).
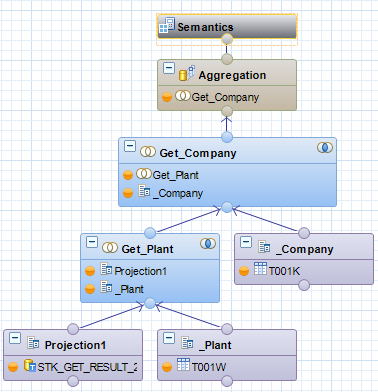
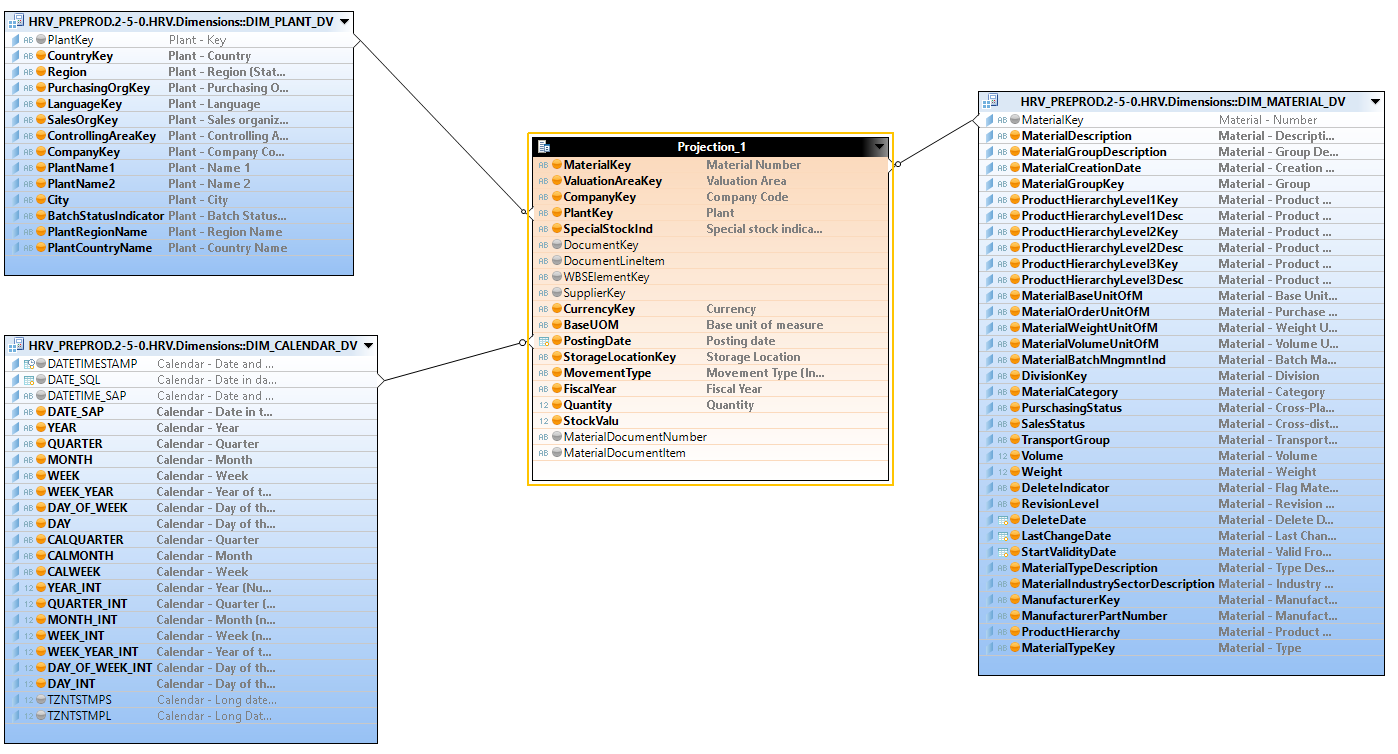
The factual view STOCK_VALUE will then consume the function table STK_GET_RESULT by adding the necessary dimensions (plant, company, …)
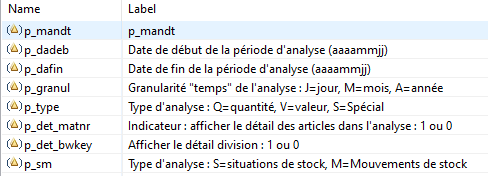
When using this view, several variables will need to be entered to limit and select:
- The analysis period ;
- The type of analysis: stock situation / stock movements, in quantity / in value;
- The temporal granularity of the analysis: Day, Month or Year.
- With or without details (Articles, Division, …)
We can now use this view in any datamart, in order to join the multiple dimensions necessary for the analyses and the realization of the reports (article, location, Time, division, …)
Reporting
The Datamart and the HANA views built are now usable on the different reporting tools: BO Webi, Microsoft PowerBI, SAC, Tableau Software, …
Below is an example on PowerBi of the report installed at one of our customers:
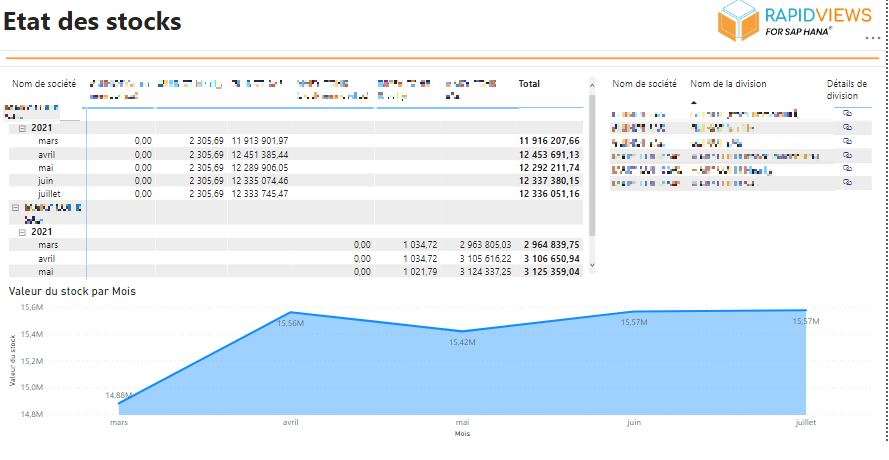
The table on the top left allows you to visualise the stock value of each company and division by month (granularity chosen in this example)
The curve shows the evolution of the stock value per month (selected time granularity)
We have provided several filters on the main analysis axes (Company, Division, Article, …) allowing to refine the analysis if needed.
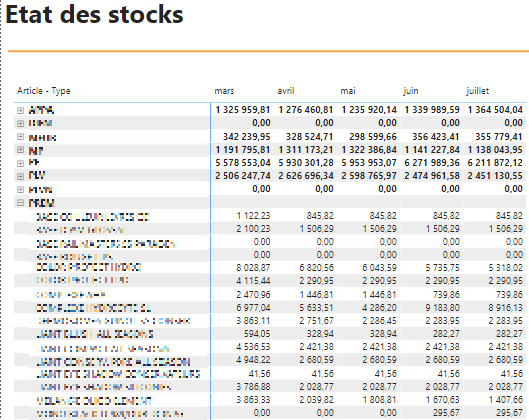
The standard report also contains a table displaying the stock situation in value (type of measurement chosen in this example) by type of item and by item.
Conclusion
RapidViews allowed us to build and quickly access complex SAP data through a factual “STOCK_VALUE” view that links stock movements, item valuation and price variation to give a real picture of the stock at any moment in time.
In addition to this stock data, we provide a set of variables that allow you to refine and customise the desired result in the report: the analysis period, the time granularity (by day/month/year), type of analysis (situation or movement), type of measurements (value or quantity), etc.
It is possible to add additional developments to this view (new calculations, new analysis axes, etc.) to meet the specific needs of our customers in terms of data to be analysed, specific business rules, source tables to be used.