
The RapidViews logo is a symbol of modernity and efficiency. It reflects innovation and simplicity, representing RapidViews' mission to provide intuitive and high-performance visual solutions.

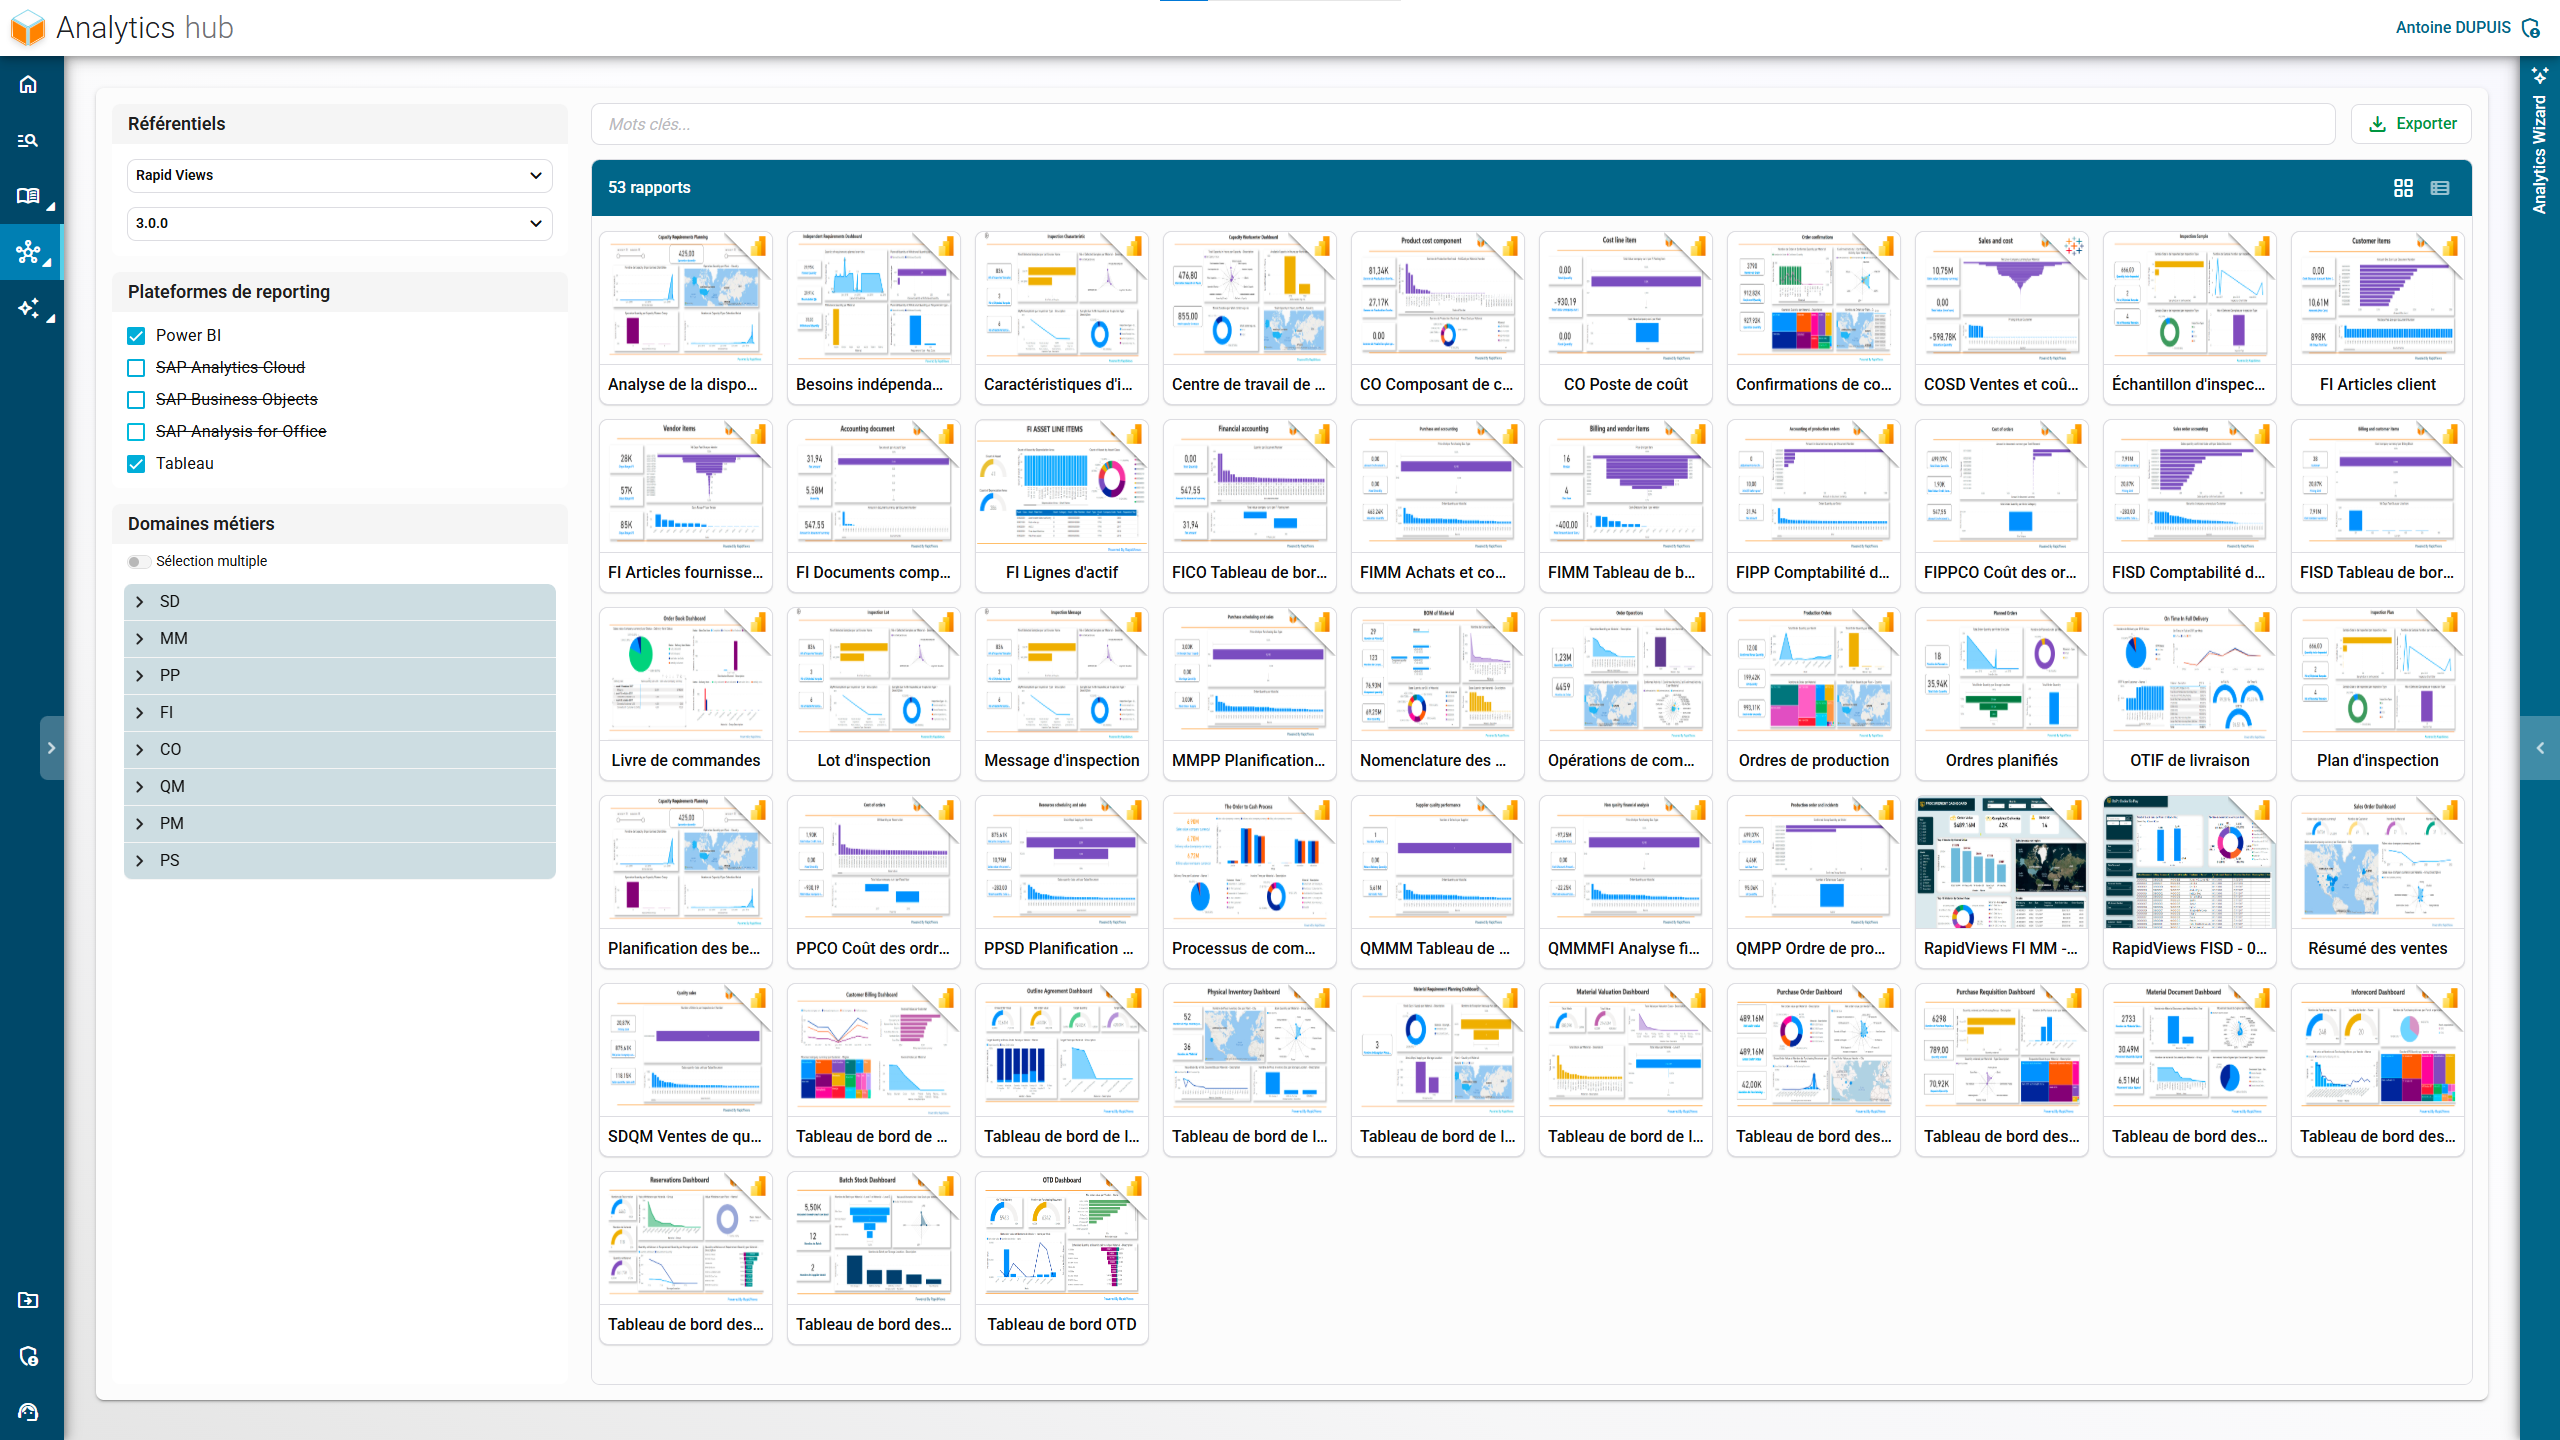
Centralize your Analytics in one place

With an average of 2 to 3 reporting tools used in organizations, the Analytics Hub provides a single reporting repository

Group all of your Analytics together in the BI Smart Repository to have a global view of your existing reporting.
Interface du Analytics Hub de RapidViews, centralisant l'accès aux analyses et rapports SAP.

Supported reporting tools

DATASPHERE FIORI BW CALCULATIONVIEWS CLOUDPLATFORM CDS VIEWS ANALYTICSCLOUD BW BEX QUERY ANALYSISFOR OFFICE
DATASPHERE FIORI BW CALCULATIONVIEWS HANA CLOUDPLATFORM CDS VIEWS ANALYTICSCLOUD BUSINESSOBJECTS ANALYSISFOR OFFICE S/4HANA S/4HANA PUBLIC CLOUD ECC ON HANA DATASERVICES ARIBA ECC HANA FULL USE

Visualize your KPIs by process and by report

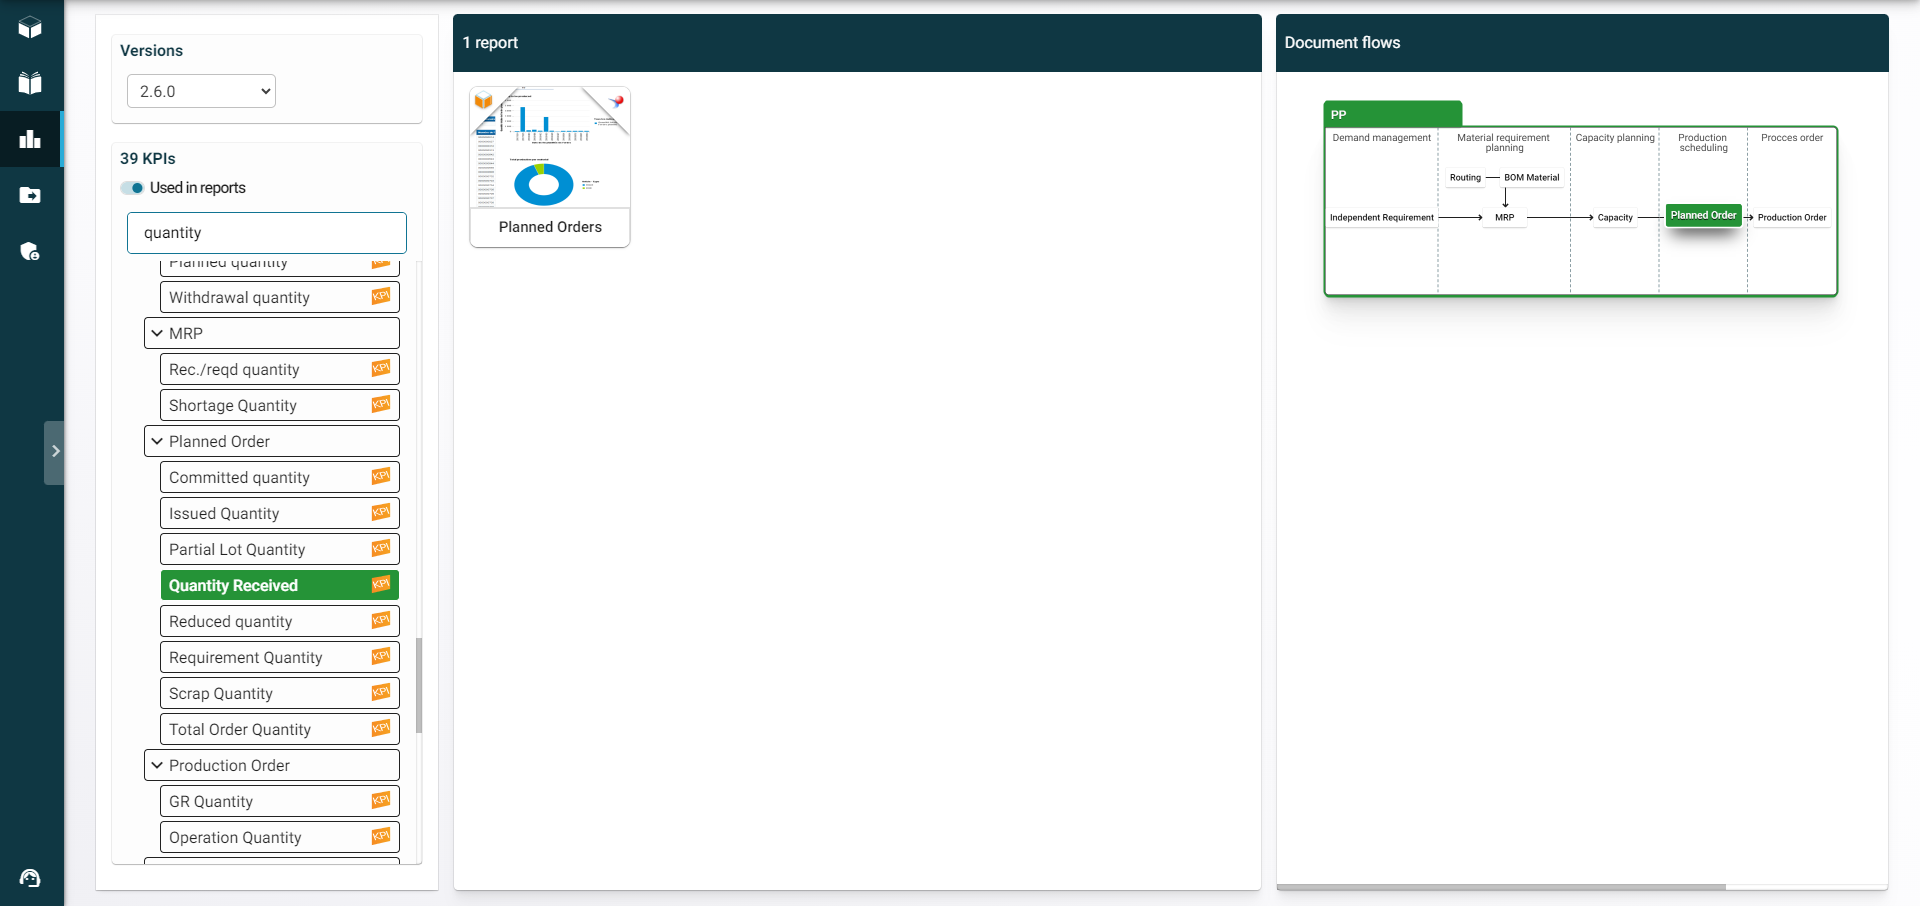
Interface du KPI Hub de RapidViews, présentant des indicateurs de performance SAP.

Search a KPI

Quickly search for a specific KPI by entering a keyword or phrase related to your industry. KPI Hub helps you identify the right KPI from a vast library of predefined metrics, saving you time navigating complex reports.
Interface du KPI Hub RapidViews, affichant un tableau de bord avec KPIs SAP.

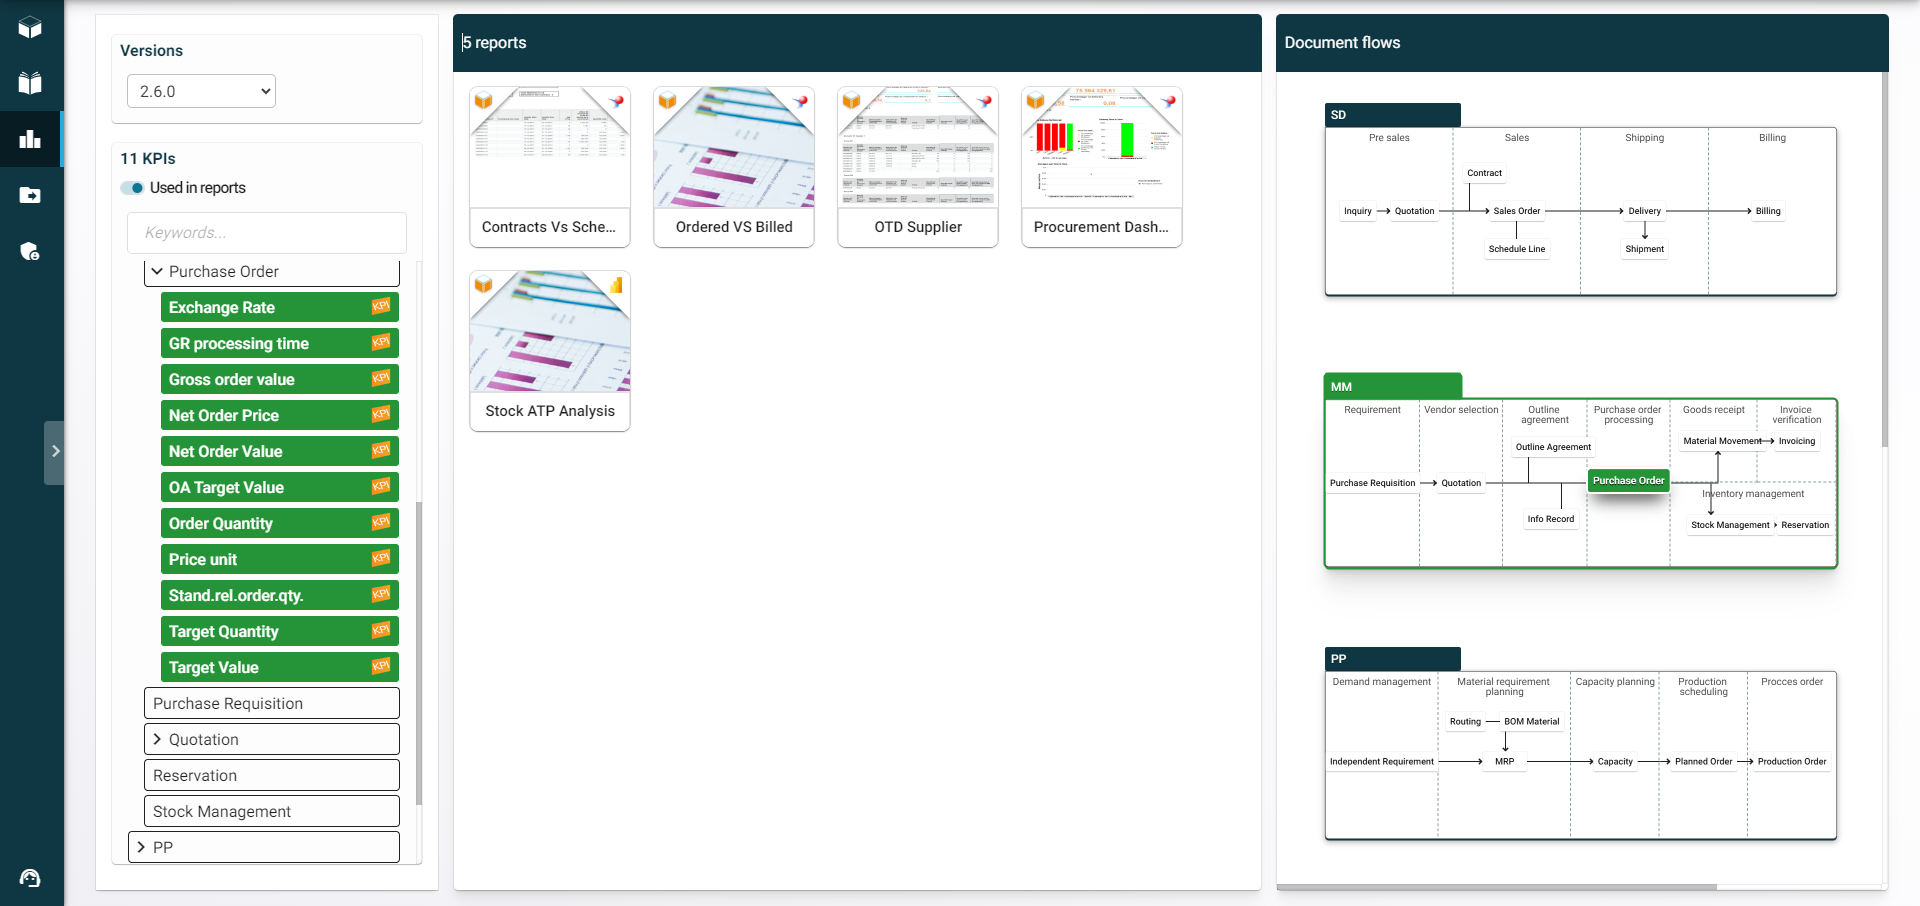
Visualize KPIs by process

Once you have found the KPI, explore its impact across the different business processes in which it is used. This approach gives you a holistic view of your company’s performance and allows you to identify the interactions between different indicators. This allows you to better understand how each KPI influences your strategic decisions.
Interface du KPI Hub RapidViews, illustrant la visualisation de KPIs pour SAP.

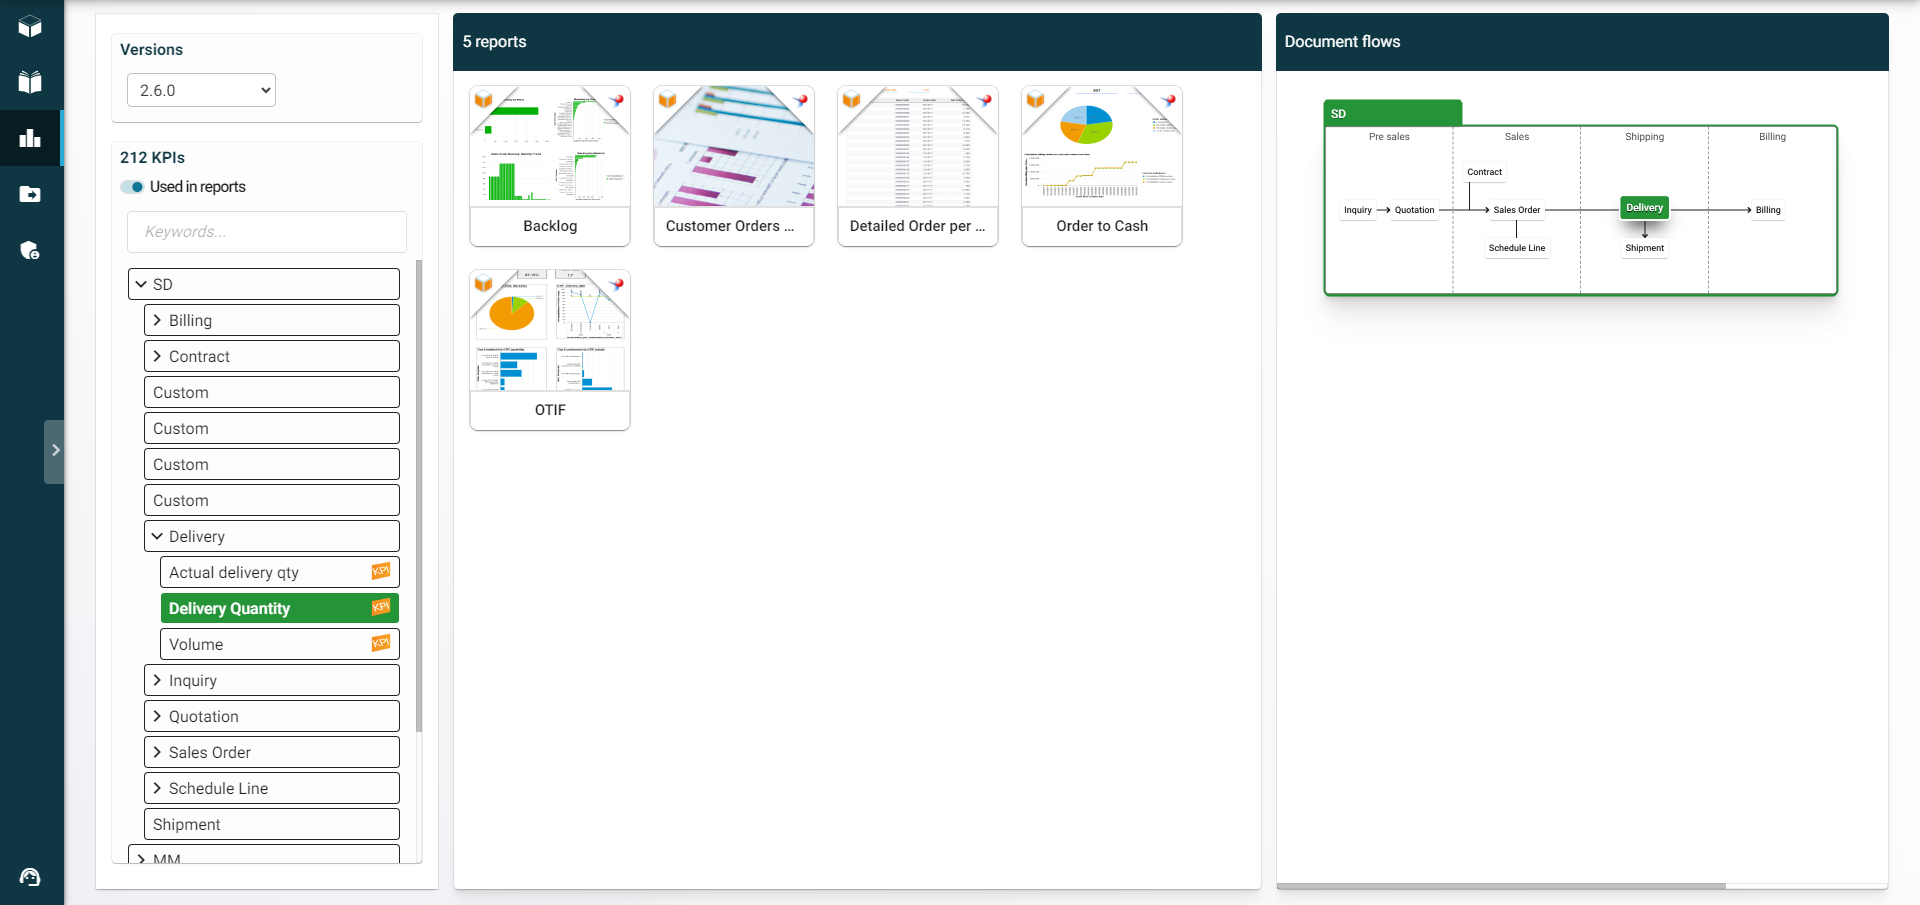
View KPIs by report

Access the reports in which the selected KPI is used. You can see how it is represented, what data is associated with it, and how it contributes to overall analyses. By understanding its context of use, you can better exploit the indicators to refine your decisions and optimize your strategies.

A portal for all your Analytics

Centralize your SAP Analytics Cloud, SAP Web Intelligence, Power BI and Tableau Software reports.

Optimization of BI processes

Bring all relevant data together in one space, enabling quick access and more efficient analysis.

Analytics Driven culture

Make informed decisions, supported by accurate and relevant information, and promote stronger collaboration between teams.

Collaboration

With quick and centralized access to Analytics objects, develop better collaboration between IT and business teams.

This site is registered on wpml.org as a development site. Switch to a production site key to remove this banner.